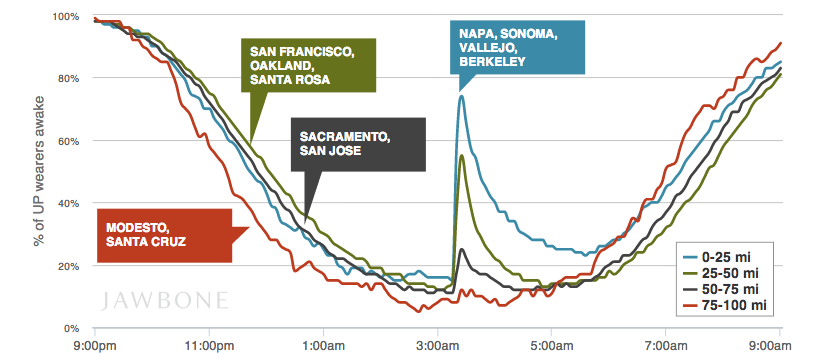
 This is a graph that Jawbone released from yesterday earthquake in Napa, Northern California. Pretty cool, when you have access to data of thousands of users and you can correlate them with external factors. On the other side this is what everyone expects when you deal with customer data. You sell a thing to someone to help them doing something, but in return you get valuable data from them. It’s the Big Data of things, and you’re the product. For good and bad.
Prt.Sc
Menu Close
Follow Me
Search
Archives
- April 2024
- March 2024
- February 2024
- January 2024
- October 2023
- September 2023
- August 2023
- July 2023
- June 2023
- May 2023
- January 2023
- November 2022
- October 2022
- August 2022
- July 2022
- June 2022
- May 2022
- April 2022
- March 2022
- February 2022
- January 2022
- December 2021
- November 2021
- October 2021
- September 2021
- August 2021
- May 2021
- April 2021
- March 2021
- February 2021
- January 2021
- December 2020
- November 2020
- October 2020
- September 2020
- August 2020
- July 2020
- June 2020
- April 2020
- January 2020
- May 2019
- April 2019
- January 2019
- December 2018
- October 2018
- May 2018
- March 2018
- January 2018
- December 2017
- September 2017
- August 2017
- June 2017
- May 2017
- April 2017
- March 2017
- January 2017
- October 2016
- September 2016
- June 2016
- April 2016
- March 2016
- February 2016
- January 2016
- December 2015
- November 2015
- October 2015
- September 2015
- June 2015
- May 2015
- April 2015
- March 2015
- February 2015
- January 2015
- November 2014
- October 2014
- September 2014
- August 2014
- July 2014
- June 2014
- May 2014
- April 2014
Comments are closed.